
For most small ice cream shops, start with a #16 disher at 2 ounces. It fits standard cones and cups, holds up under a $4–$6 price point, and yields 16 portions per quart. If you need a number before your cost model is built, that is the number.
Here is what the generic advice misses: small shops carry less margin for error than large operations — and the scoop size decision hits differently at small-shop volume. We have worked with independent operators running 150 scoops a day where a single disher swap cut food cost by double digits in the first week. We have also watched small shops hemorrhage margin for an entire season because nobody questioned the scoop that came with the opening kit.
At a 10-seat scoop shop, choosing the right ice cream scoop size becomes a powerful advantage. When the scoop size is defined and used consistently, portioning stays accurate, margins stay protected, and every serving delivers the same reliable experience — service after service, day after day.
What this page gives you:
Scoop sizes by ounce yield — matched to small-shop price points and vessel formats
The cost math behind each size decision using real kitchen-tested numbers
A portioning system that works with a small team under real service conditions
The audit process that keeps portions honest when you are running lean
This is not chain playbook advice scaled down. It is the portioning methodology built specifically for the margin reality of a small ice cream operation.
TL;DR Quick Answers
Ice Cream Scoop Size
The commercial default is a #16 disher at 2 fluid ounces. One formula covers every size: 32 ÷ scoop number = fluid ounces per portion.
Common sizes and yields:
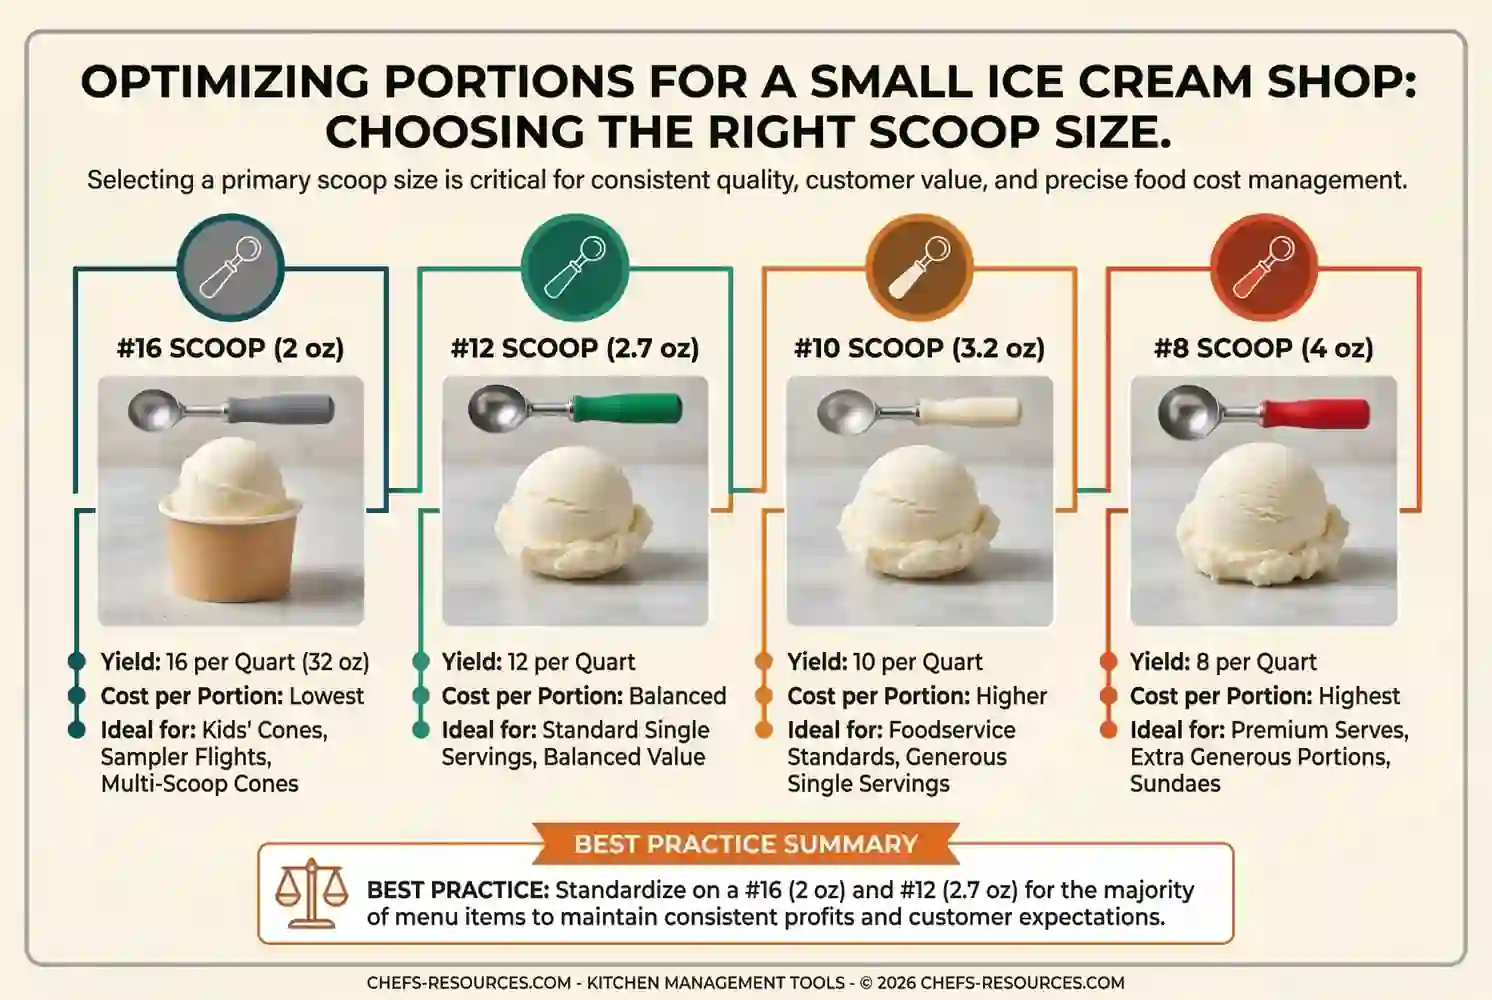
#8 = 4 oz — large single scoop, premium presentations
#10 = 3.2 oz — standard foodservice single scoop
#12 = 2.67 oz — cost-conscious single scoop, two-scoop presentations
#16 = 2 oz — commercial default, high-volume and small shop operations
#20 = 1.6 oz — two-scoop volume service, tighter margin models
For small ice cream shops specifically:
Budget/family-friendly ($3–$5): #16 for single scoops
Mid-range neighborhood ($5–$7): #12 for single scoops
Premium/artisan ($7–$10): #10 for single scoops
Three things determine the right size:
Menu price
Vessel format — cone or cup
Food cost target — small shops below $2M run a median 33.7% food cost
A higher scoop number always means a smaller portion. A #16 gives you 192 portions from a 3-gallon tub. A #10 gives you 120. That 72-portion difference at a $5 menu price is $360 in revenue potential from the same product cost.
In every small shop we have worked with, the scoop size was inherited — not chosen. Confirming the number, running the yield math, and posting a color-coded chart inside the reach-in door costs under $50 and pays back in the first week of service.
Top Takeaways
The scoop size decision is a food cost decision. Most small shop operators never actually make it.
Commercial default: #16 disher at 2 ounces
In most shops we've worked with: not chosen — inherited from the opening kit
Never connected to a cost model, a vessel check, or a margin calculation
Everything built on top of that non-decision compounds quietly across every service
The tell: a P&L asking questions nobody can answer
At 1.1% pre-tax income, a half-ounce of daily drift is not a variance. It is a structural risk.
Shops below $2M in annual sales: 33.7% food cost / 1.1% pre-tax income
At that margin: a #10 vs. #12 disher across 150 daily scoops does not average out
It compounds across every service, every week, every season
It gets misdiagnosed as a supplier problem, a pricing problem, a staffing problem
It is almost never traced back to the station without an audit system in place
The highest-leverage fix in a small ice cream shop costs under $50 and pays back in the first week.
Confirm the disher number
Run yield math against the menu price
Check the vessel fit
Post a laminated color chart inside the reach-in door
Build a quarterly audit into the routine
Operators who run this check for the first time almost always find at least one point out of alignment from day one
70% of foodservice food waste is plate waste. At a small shop scale, there is no revenue line to absorb it.
The waste problem is not in the walk-in — it is on the plate
One size-too-large disher on a 150-scoop day is not a sustainability issue
It is a daily, compounding margin transfer from the operation to the trash
Repeated every service
No chain-scale revenue to offset it
Small ice cream shops are the frontline of the U.S. ice cream industry — not the footnote.
Majority of U.S. ice cream marketing: local and regional
Most manufacturers: family-owned, 50+ years in business
Industry economic contribution: $11.6 billion — running through local independent operations
Those same operations are most exposed to an unconsidered scoop station
The discipline that protects that margin is not complicated — it just has to be applied deliberately, from day one, at the one tool that touches every transaction
The Starting Point: Why the #16 Disher Became the Small Shop Default
The #16 disher at 2 ounces did not become the commercial standard by accident. It hits the intersection of three practical realities that matter most to small ice cream operations: it fits the most common cone and cup formats without overhanging or looking thin, it yields 16 portions per quart which makes tub cost math straightforward, and it holds up under the $4–$6 price point that anchors most independent scoop shop menus.
What we tell small shop operators consistently: the #16 is a starting point, not a permanent answer. It is the right place to begin before your cost model is fully built and integrated into a recipe template. Where you land after running the math may be different — and that difference is worth knowing before it shows up as a food cost problem you cannot explain.
How Small Shop Volume Changes the Scoop Size Calculation
At chain scale, portioning drift averages out across multiple revenue lines. At a small shop scale, it does not. A 150-scoop daily volume is the entire operation — and every ounce decision runs through one or two dishers, one station, one team.
What changes at small shop volume:
A half-ounce of daily drift across 150 scoops compounds faster and recovers slower than at high-volume operations
One wrong disher size affects every transaction — there is no secondary revenue line to absorb the hit
Staff consistency matters more when one person runs the scoop station for an entire service
A single disher swap produces an immediate, measurable result — we have seen small shops cut food cost by double digits in the first week
The margin reality is specific: industry pre-tax margins run 3–5% across foodservice. Small independent operations typically run at the lower end of that range. At 3% pre-tax margin, the scoop station is not a minor detail — it is one of the highest-leverage cost decisions in the building.
Matching Scoop Size to Your Concept and Price Point
The scoop size that works for your shop is the one that connects four variables: your menu price, your vessel format, your food cost target, and your concept positioning. Here is how that plays out across common small shop models.
Budget and family-friendly operations ($3–$5 single scoop):
#16 (2 oz) for single scoops — fits standard wafer cone and 4 oz cup
#20 (1.6 oz) for two-scoop presentations — visual impact without doubling cost
Food cost target: 28–32% of menu price
Mid-range neighborhood shops ($5–$7 single scoop):
#12 (2.67 oz) for single scoops — satisfying portion that justifies the price step
#16 (2 oz) for two-scoop presentations
Food cost target: 30–34% of menu price
Premium and artisan operations ($7–$10 single scoop):
#10 (3.2 oz) for single scoops — portion size that matches premium price expectation
#12 (2.67 oz) for two-scoop or specialty presentations
Food cost target: 32–36% of menu price — offset by higher menu price, not higher volume
The Cost Math Behind Every Scoop Size Decision
This is the calculation most small shop operators skip at opening — and spend months paying for afterward. Using a standard 3-gallon tub at $45 as a baseline:
Total fluid ounces: 384
Cost per fluid ounce: $0.117
What each common disher actually costs per portion:
#10 (3.2 oz): $0.37 per scoop
#12 (2.67 oz): $0.31 per scoop
#16 (2 oz): $0.23 per scoop
#20 (1.6 oz): $0.19 per scoop
At 150 scoops per day, the difference between a #10 and a #16 is $21 in daily product cost. Across a 180-day season that is $3,780 — from a single disher decision that most small shop operators never consciously made.
Run this math against your actual tub cost and your actual menu price before your next order. It takes ten minutes and gives you a number the rest of your cost model can sit inside.
Building a Portioning System That Works With a Small Team
The portioning challenge in a small shop is not conceptual. It is operational. You may have one person running the scoop station on a Saturday afternoon rush with no time to check charts or question tools — which is exactly where strong kitchen management practices help keep portions consistent even under pressure. The system has to work under those conditions — or it does not work at all.
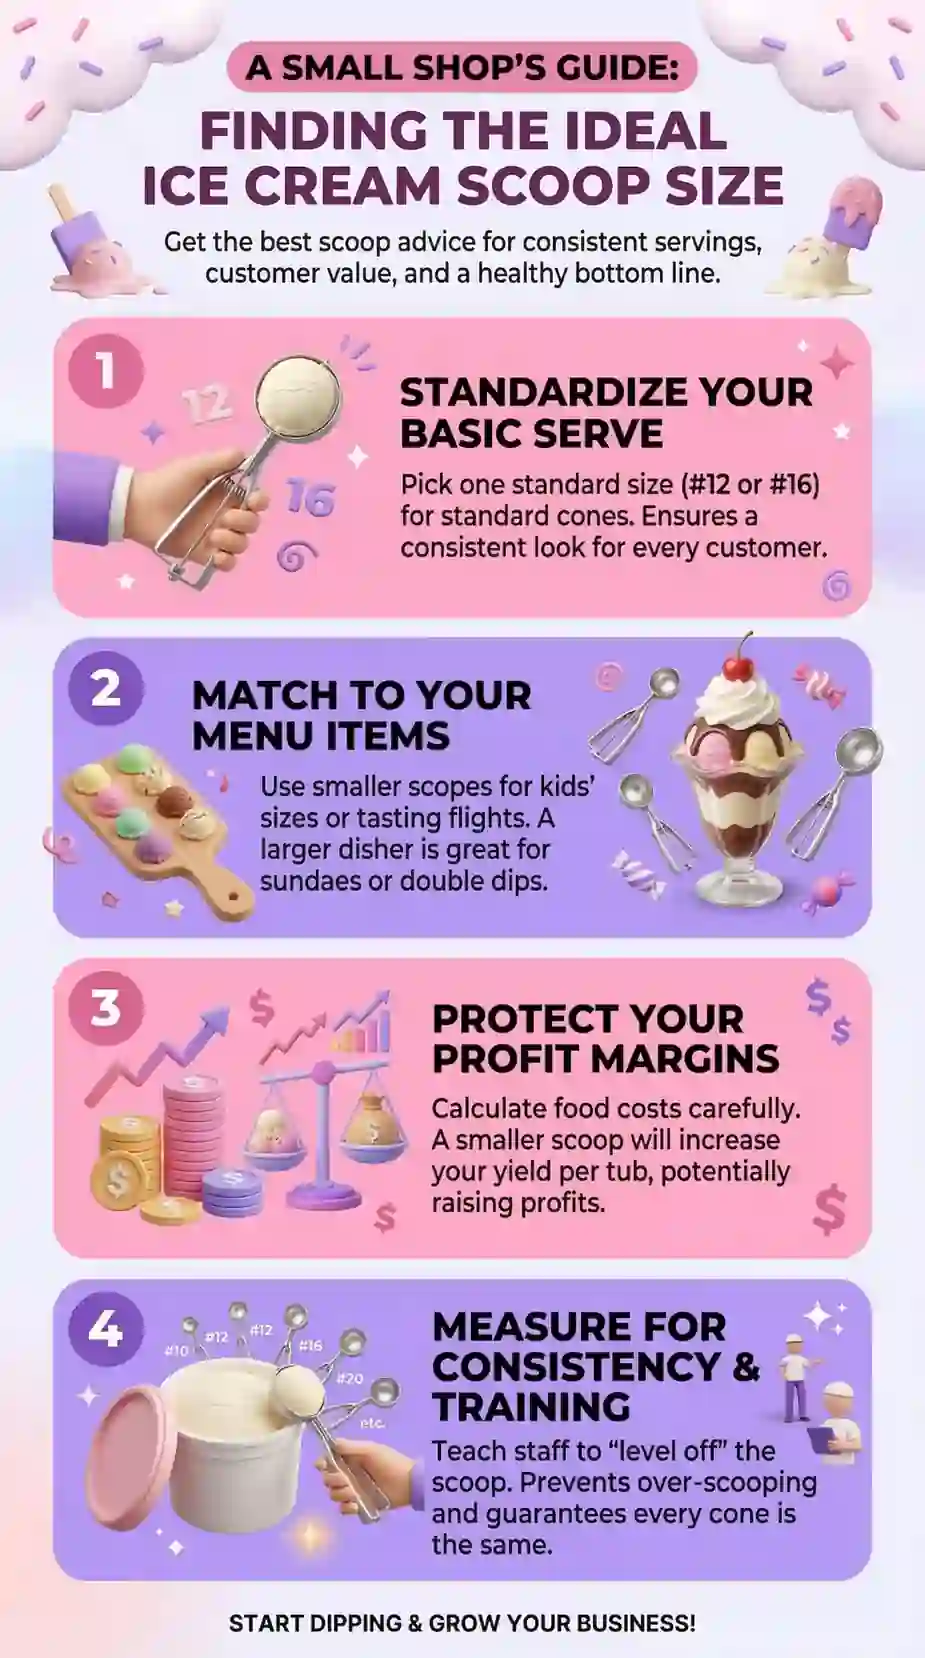
The system we recommend for small shop operations:
Assign one disher number per menu item. No ambiguity. No staff judgment calls during service.
Color-code everything. Post the handle color next to the price on the station reference card. Staff grab the right tool by color — not by reading a number under pressure.
Level your scoops consistently. A heaped scoop adds 25–30% more product. Train once, reinforce at pre-service.
Weigh ten scoops monthly. Divide by ten. Check it against your opening baseline. Catch drift before it shows up on the P&L.
Post the chart inside the reach-in door. Color, number, ounce yield, and cost per portion — on one laminated card where staff see it every time they reach for the product.
Total setup cost: under $50. Time to implement: one pre-service. Payback: measurable within the first week.
The One Mistake Most Small Ice Cream Shops Make at Opening
We have worked with enough small shop operators to identify the pattern: the scoop that came with the opening kit became the permanent scoop. No yield math was run. No vessel check was done. No cost model was built around it. The shop opened, service started, and the portioning decision that should have been made in week one became the food cost mystery that nobody solved until month six.
The fix is not complicated. Pull your current disher. Find the number. Divide 32 by that number. Calculate your ounce yield. Multiply by your cost per fluid ounce. Check it against your menu price. If the math does not work, swap the disher. Post the chart. Build the audit into your monthly routine.
That is the entire decision. Made correctly at opening, it costs nothing and protects your margin from day one. Made incorrectly — or not made at all — it compounds silently across every service until the season ends and the numbers do not add up the way they should.
"Every small shop food cost problem we've been called in to diagnose has started the same way — someone pulls the disher out of the drawer and can't tell us why that size was chosen. The answer is always the same: it came with the kit. At 150 scoops a day, that non-decision is the entire operation's portioning problem. We've seen operators fix a six-month food cost mystery in a single afternoon by confirming the disher number, running the yield math, and posting a chart inside the reach-in door. The scoop didn't change. The margin did."
Essential Resources
Small shop margins don't leave room for the wrong reference at the wrong moment. Every resource below has a specific job in the decision chain — from confirming what your disher is actually delivering to building the cost model that makes the number on the handle mean something. We've used all of them. Here's why each one earns its place.
The Chart We Built Because No One Else Had Done It Right Chef's Resources — Disher Scoop Sizes Chart https://www.chefs-resources.com/culinary-conversions-calculators-and-capacities/scoop-disher-sizes/ We built this reference after years of watching portion costs drift in kitchens that had no reliable conversion tool — scoop number to fluid ounces, tablespoons, milliliters, and scoops per cup, across every standard size from #4 through #100, verified against manufacturer specs and our own kitchen testing. Pull your current disher, find your number, and know exactly what it is delivering before you build a single line of cost math around it.
The Buying Guide That Explains Why the Wrong Tool Destroys Portion Consistency WebstaurantStore — Ice Cream Scoop & Food Disher Guide https://www.webstaurantstore.com/guide/717/kitchen-scoop-and-disher-guide.html We've watched small shop operators burn through a full set of dishers in a single busy season trying to scoop hard-pack ice cream — wrong tool, accelerating wear, portions drifting before anyone identified the mechanism as the problem. This guide covers the difference between dishers, scoops, and spades, and explains which construction and release mechanism actually holds up under frozen product at small shop volume. Read it before your next equipment order.
The Federal Capacity Reference That Holds Up in Any Compliance or Audit Setting USDA Food Buying Guide — Table 13: Sizes and Capacities of Scoops (or Dishers) https://foodbuyingguide.fns.usda.gov/Content/TablesFBG/Table13_FBG_Sizes_and_Capacities_of_Scoop_s_(or_Dishers).pdf Primary source. No interpretation. No brand agenda. This is the government-sourced capacity table that institutional foodservice has used for decades — and the one that holds up under any documentation or compliance review. If you need a defensible baseline yield number that isn't tied to a manufacturer's marketing, this is it.
The Plate Cost Framework That Makes Your Scoop Size a Real Business Decision Chef's Resources — Plate Cost: How to Calculate Recipe Cost https://www.chefs-resources.com/kitchen-forms/recipe-template/plate-cost-how-to-calculate-recipe-cost/ The scoop size decision doesn't live in isolation — it lives inside a cost model, and most small shop operators have never built one. This is the step-by-step methodology we use for calculating per-portion cost from tub price to plate — the exact framework that tells you whether your current disher number is protecting your margin or quietly eroding it for every service.
The Food Cost Methodology That Explains Why Half an Ounce Is Never Just Half an Ounce The Culinary Pro — Calculating Food Cost https://www.theculinarypro.com/calculating-food-cost At 3–5% pre-tax margin, the difference between a #12 and a #16 disher isn't a preference — it's a food cost percentage problem waiting to surface. This practitioner-level framework covers plate costing, food cost percentage, and the Q Factor in a format that translates directly to portion-based operations like scoop shops. Use it to understand the cost model your disher decision needs to sit inside before you pour the first scoop.
The Application Guide That Stops Staff From Grabbing the Wrong Disher Mid-Rush Gygi — Food Disher Sizing Guide https://gygi.com/blogs/create/food-disher-sizing Most sizing guides are organized by number. This one is organized by application — which is how a small shop station actually operates when one person is running service alone and doesn't have time to read a chart. Use it to match each menu item to the correct disher, build your color-coded station reference, and eliminate the judgment calls that create portion drift under pressure.
The Cost Control Foundation That Should Be Read Before Opening Day — Not After BC Campus Open Textbook — Controlling Food Costs https://opentextbc.ca/basickitchenandfoodservicemanagement/chapter/controlling-food-costs/ We've sat with small shop operators six months into their first season trying to diagnose a food cost problem that started on day one with a portioning decision that was never made. This is the methodology that should have been read first — the operational and academic foundation for understanding how portion standardization directly controls food cost percentage, and why the scoop station is a cost control decision before it is anything else.
These essential resources help small shop operators verify scoop yields, choose the right equipment, and build a defensible cost model so portioning decisions consistently protect margins. This same disciplined approach reflects the principles behind mаxіmіzіng prоfіt on уоur farm, where careful measurement, efficient resource use, and consistent operational systems directly support stronger financial outcomes.
Supporting Statistics
We have never met a small ice cream shop operator who planned to lose money on portion size. We have met plenty who did. These numbers explain why — and they were already operating inside every small shop we have worked with. Most operators just had not seen them framed this way yet.
The Industry That Runs on Local Volume — And Loses the Most When Small Shops Don't Portion Correctly
Most small shop operators think of themselves as separate from the broader ice cream industry. The production data says otherwise. This market is driven by local and regional operations — the same businesses running 150 scoops a day with one person at the station.
What the data shows:
1.31 billion gallons of ice cream produced in the U.S. in 2024
$11.6 billion direct economic contribution to the U.S. economy
26,704 direct jobs — majority at family-owned operations in business 50+ years
Premium and regular ice cream = 80% of the market
Ice cream marketing is primarily local and regional — small shops are the frontline, not the footnote
Why the 80% figure matters at station level:
Premium and regular ice cream is the densest, most margin-sensitive product category
It is exactly where half-ounce yield variance compounds hardest per service
Local operators driving that market share have no secondary revenue line to absorb the drift
We have watched that dynamic play out in kitchen after kitchen. The data confirms what the P&L was already showing.
Source: International Dairy Foods Association (IDFA) — Ice Cream Sales & Trends https://www.idfa.org/ice-cream-sales-trends
The Waste Number That Ends the "It's a Supplier Problem" Conversation
The most common misdiagnosis in small ice cream operations: treating a portioning problem as a purchasing problem. Operators tighten supplier negotiations, switch tub sizes, shop around on pricing. The food cost number barely moves. It barely moves because the problem was never in the supply chain. It was at the station.
What the data shows:
70% of restaurant and foodservice food waste is plate waste — food served but not eaten
12.5 million tons of surplus food generated by restaurants and foodservice in 2024
85%+ of that surplus went to landfill or incineration
Right-sized portioning could reduce industry food waste by 2.35 million tons annually
Estimated operator savings from portion-right sizing: $547 million across the sector
What this means at small shop scale:
At a chain: surplus food is a managed cost category spread across multiple revenue lines
At a small scoop shop: it is the margin — full stop
A #10 vs. #12 disher across 150 daily scoops is not a rounding variance
It compounds quietly across an entire season
It surfaces as a food cost problem that looks like a dozen other things
It almost never gets traced back to the station unless an audit was built in at opening
In our experience, almost no one builds that audit in at opening.
Source: ReFED — Restaurant and Foodservice Food Waste Data https://refed.org/stakeholders/restaurants-and-foodservice/ https://refed.org/articles/new-refed-and-datassential-research-shows-consumer-demand-for-customizable-portions-in-restaurants/
The Margin Reality That Makes Every Unconsidered Disher Decision a Structural Risk
The operators who push back hardest on portion discipline are almost always the ones operating closest to the margin edge the data describes. They do not yet see the connection between the number on the disher and the number at the bottom of the P&L. Once they run the math, the conversation changes immediately.
What the data shows:
Full-service operators: median pre-tax income of 2.8% of sales in 2024
Limited-service operators: median pre-tax income of 4.0% of sales in 2024
Operators below $2M annual sales: 33.7% food cost / 1.1% pre-tax income
Operators above $2M annual sales: 31.0% food cost / 4.3% pre-tax income
A 2.7-point food cost difference = a 3.2-point swing in pre-tax income
Food and labor costs each up 35% since 2019 — margins have not followed
53% of operators as of November 2024 still carrying pandemic-era debt
What this means for small shops specifically:
Most small ice cream shops operate below the $2M threshold
That puts them in the 33.7% food cost / 1.1% pre-tax income bracket
At that margin, one unconsidered disher decision does not stay small
It compounds into a problem that looks like a pricing issue, a supplier issue, a staffing issue
It is almost never identified as a portioning issue without an audit system at the station
We have sat across the table from operators in exactly that position more times than we can count. The fix was the same every time:
Confirm the disher number
Run yield math against the menu price
Post the chart at the station
Build a quarterly audit into the routine
Total cost: under $50. Payback: first week of service. The math was always there. It just needed someone to connect it to the station.
Source: National Restaurant Association — Restaurant Operations Data Abstract, 2025 https://restaurant.org/research-and-media/research/restaurant-economic-insights/analysis-commentary/new-association-report-helps-operators-gauge-their-restaurant-performance/ https://restaurant.org/research-and-media/research/inflation/
Final Thoughts & Opinion
After years working with small ice cream shops, here is what we keep coming back to: the scoop size question is never really about the scoop. It is about whether the person opening the shop made a deliberate business decision, with the portion standard documented in a recipe template, or inherited a default and built an entire operation around it without realizing it.
We have worked with operators who spent months engineering their menu, sourcing premium products, and designing a customer experience worth returning for — then grabbed whatever disher was in the opening kit without a second thought. That single unconsidered moment became the foundation of their food cost model. Everything downstream was built on top of a number nobody chose.
That is the pattern. Not negligence. Not incompetence. Just the invisible nature of a small tool that does its job quietly, every service, without drawing attention to itself — until the P&L starts asking questions nobody can answer.
What the Numbers Actually Tell Us
The industry data frames the stakes precisely:
Shops below $2M in annual sales: 33.7% food cost / 1.1% pre-tax income
Food and labor costs each up 35% since 2019
70% of foodservice food waste is plate waste — food served but not eaten
Premium and regular ice cream = 80% of the market — the densest, most margin-sensitive category
The U.S. ice cream market is fundamentally local — small shops are not the footnote, they are the industry
At 1.1% pre-tax income, there is no category of daily compounding variance that does not matter. The scoop station is not a minor operational detail. It is one of the highest-leverage cost decisions in the building.
What We Have Seen That the Data Cannot Show
The numbers frame the margin reality. What they cannot capture is the pattern we have watched play out in actual kitchens.
We have worked with operators who:
Ran a full season on the wrong disher and never traced a two-point food cost gap back to the station
Fixed a six-month margin problem in a single afternoon with a disher swap and a laminated chart
Spent hours negotiating supplier pricing while losing more per day at the scoop station than the negotiation ever recovered
Built well-priced menus on top of a portioning model never connected to a cost calculation
The fix was the same every time:
Confirm the disher number
Run yield math against the menu price
Check the vessel fit
Post the chart at the station
Build a quarterly audit into the routine
Total cost: under $50. Payback: first week of service.
Our Honest Take
Small ice cream shops don't struggle with margin because of the wrong flavor lineup or a bad location. The ones that struggle almost always share one thing: a portioning decision that was never actually made — and a scoop station that has been running on that non-decision ever since.
The scoop is the highest-frequency transaction in the building. Every service. Every day. Every season.
At 1.1% pre-tax income with food costs at 33.7% of sales and input costs up 35% since 2019 — there is no version of this math where the disher decision does not matter.
Make it deliberately. Connect it to your cost model. Build a system around it. After years of watching small shop operators on both sides of that decision, we have not found a reason to change that position.
FAQ on Ice Cream Scoop Size for Small Ice Cream Shops
Q: What is the best scoop size for a small ice cream shop?
A: Start with a #16 disher at 2 ounces. Treat it as a starting point — not a permanent answer.
Every small shop we have worked with that struggled with food cost had one thing in common: a scoop size that was never consciously chosen. It came with the kit. The menu was priced around a different assumption.
Match disher to concept and price point:
Budget/family-friendly ($3–$5): #16 (2 oz) single, #20 (1.6 oz) two-scoop
Mid-range neighborhood ($5–$7): #12 (2.67 oz) single, #16 (2 oz) two-scoop
Premium/artisan ($7–$10): #10 (3.2 oz) single, #12 (2.67 oz) two-scoop
Three things determine the right number:
Menu price
Vessel format — cone or cup
Food cost target
Everything else — including the food cost problems that surface six months in — is a consequence of whether those three things were aligned at opening.
Q: How many scoops do I get per tub with different disher sizes?
A: Formula: 32 ÷ scoop number = fluid ounces per portion. Divide tub volume by that number to get portion count.
Portions per 3-gallon tub (384 fluid ounces):
#8 (4.0 oz): 96 portions per tub
#10 (3.2 oz): 120 portions per tub
#12 (2.67 oz): 144 portions per tub
#16 (2.0 oz): 192 portions per tub
#20 (1.6 oz): 240 portions per tub
The number most small shop operators don't run until we show them:
Moving from a #10 to a #16 = 72 additional portions from the same tub
At a $5 menu price = $360 in additional revenue potential from identical product cost
We have shown this math to operators running a #10 on a menu priced for a #16
The conversation changes immediately
Run this against your actual tub size and menu price before your next order.
Q: How do I know if my scoop size is hurting my food cost?
A: Run this four-step check. Fifteen minutes. Definitive answer.
Find your disher number. Check the stamp on the bowl or handle. No number visible? Measure ten level scoops into a liquid measuring cup. Divide by ten. That is your real average yield.
Calculate your portion cost.
Tub cost ÷ total fluid ounces = cost per fluid ounce
Cost per fluid ounce × scoop ounce yield = cost per portion
Not an estimate — the actual number your cost model should be built around
Check your food cost percentage.
Portion cost ÷ menu price × 100 = food cost %
Small shops below $2M in sales: median 33.7% food cost
Running significantly above that? The station is the first place to look — not the supplier, not the menu price
Check your vessel fit.
Significant overhang in cone or cup = over-portioning for your format
Thin or unsatisfying appearance = under-delivering on perceived value for your price point
Neither shows on a P&L — both show up in your food cost percentage
What we find every time: at least one of these four points is out of alignment. The fix: disher swap and a laminated chart inside the reach-in door. Under $50. Payback in the first week.
Q: Should a small ice cream shop use dishers or ice cream scoops?
A: The wrong tool at the service station is one of the most expensive — and least visible — mistakes a small shop can make.
We have watched operators burn through a full disher set in a single busy season scooping hard-pack. The mechanism degrades. Release becomes inconsistent. Portions drift before anyone identifies the tool as the problem.
Use true ice cream scoops for:
All frozen service at the customer-facing station
Hard-pack ice cream in any density or flavor
High-volume service where release consistency affects portion accuracy
Premium product where presentation affects perceived value
Use dishers for:
Prep applications: mix-ins, toppings, cookie dough
Softer products that don't require frozen resistance
Back-of-house batch work and mise en place
The rule:
True ice cream scoops at the service station
Dishers in prep
Match the tool to the application
Result: equipment lasts longer, portions stay consistent, food cost reflects what the menu was priced to deliver.
Q: How do I train a small team to portion ice cream consistently?
A: Expecting staff to remember numbers during a rush does not work. Every operator who has tried to build consistency through verbal instruction alone has learned this — usually during their first busy Saturday. The system has to work without thinking.
Five-step small shop portioning system:
Assign one disher number per menu item.
No judgment calls during service
One item, one scoop, no exceptions
Color-code the station.
Post handle color next to menu item on the station card
Staff grab by color — not by reading a number under pressure
Train level scoops from day one.
A heaped scoop adds 25–30% more product
Demonstrate correct technique at first pre-service
Reinforce at the start of each season
Post the chart inside the reach-in door.
Color, number, ounce yield, cost per portion — one laminated card
Not in the office. Not in the training manual. At the station.
Staff see it every time they reach for product
Audit monthly during peak season.
Weigh ten consecutive scoops of highest-volume flavor
Divide by ten
Check against opening baseline
Catch drift before it surfaces on the P&L — not after
Setup time: one pre-service. Total cost: under $50. Works with a team of one as effectively as a team of five. The discipline lives in the system — not in expecting anyone to remember a number during a Saturday afternoon rush.


